A staggering 41% of organizations state that metrics and reporting are a core weakness in their governance, risk, and compliance (GRC) processes. Despite the critical role compliance plays in ensuring security and resilience, many companies struggle to gather reliable data and effectively communicate their security posture. This gap isn’t just a minor inconvenience—it can lead to blind spots in risk management and challenges in proving resilience to regulators and stakeholders.
At Scrut, we recognize the importance of robust reporting, but we also understand that it shouldn’t be a time-consuming burden. That’s why our platform is designed to simplify the process, offering dashboards and reporting capabilities that deliver actionable insights with minimal effort.
Let’s explore how these features can transform risk and compliance for your company.

Challenges of spreadsheet reports and clunky GRC tools
Before we dive into Scrut’s solutions, let’s take a look at some common challenges of relying on outdated spreadsheet reports and unintuitive GRC tools:
1. Limited visibility into compliance posture
Infosec leaders need to be on top of every activity necessary for maintaining a compliant posture. However, managing tasks across IT, HR, Security, DevOps, Engineering, and more is tedious. Without a structured view of policies, evidence, controls, risks, vendors, or training, it’s easy to miss critical issues and slow down progress.
2. Communication gaps in security initiatives
Even if teams manage to pull together an overview, presenting it to leadership, auditors, and other stakeholders is another challenge. Reports generated from Excel or Tableau often lack the context needed for effective decision-making. You can’t link data points back to relevant artifacts or issues. This makes it difficult to communicate the real-time security posture.
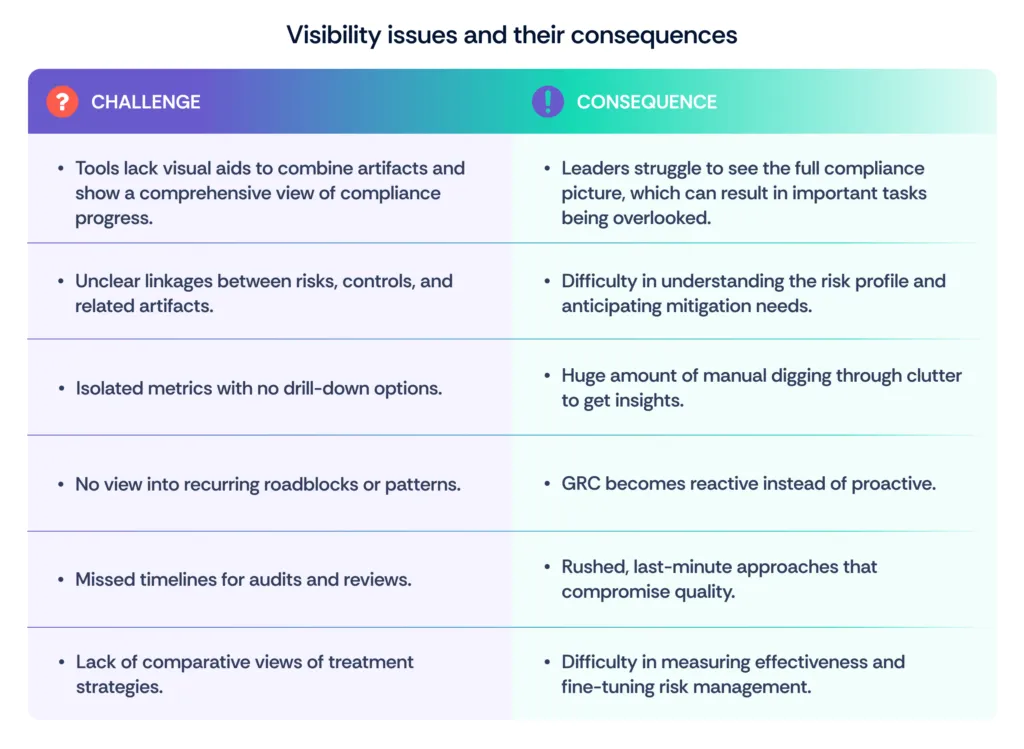
Visibility issues and their consequences
How dashboards and reports streamline your workflow?
When it comes to managing GRC programs, one of the most time-consuming tasks is gathering, analyzing, and presenting data to leadership. Dashboards and reports take the pain out of this process by providing a streamlined way to communicate insights without the need for endless hours of data digging and analysis.
1. Accelerate compliance progress
Dashboards let you effortlessly keep track of progress, manage stakeholders, and make quick, informed decisions.
a. Get an overview of progress instantly
Dashboards allow you to easily identify key GRC metrics and get informed about the current status of crucial elements within each module. This top-level view ensures you’re always aware of where things stand and always capable of identifying and solving bottlenecks.
b. Monitor tasks and foster collaboration
With a clear view of your compliance landscape, you can easily track tasks assigned to each stakeholder at different stages. By managing workloads and prioritizing crucial tasks, you can facilitate seamless collaboration, keeping everyone aligned and focused on shared goals.
c. Make sharper and more accurate decisions
Second-degree filters and views enable you to slice and dice the visible data, allowing for a more detailed and accurate analysis. This precision helps ensure that you’re focusing on the right information, leading to more informed and effective decision-making.

2. Simplify executive reporting
Reports make it easier to share essential insights with leadership, helping you stay on top of critical issues without missing a beat.
a. Communicate effectively with leadership
Your executive team needs a high-level summary of compliance progress, and reports provide exactly that. These summarized reports keep your leadership informed without overwhelming them with details, making your communication more efficient.
b. Avoid potential blind spots in security posture
Reports keep you informed of critical pending tasks and non-compliant artifacts, even without drilling down into the platform. This high-level awareness helps you prioritize activities and address issues before they escalate.

Let's take a closer look at dashboards and reports
Here’s a breakdown of the useful features of dashboards and reports.
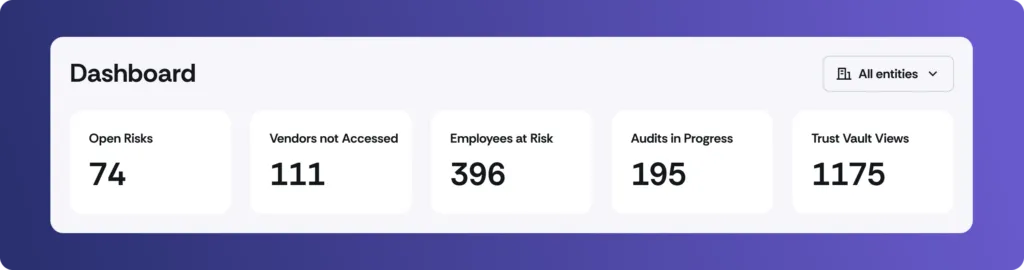
a. Compliance Dashboard
Get a high-level overview of your organization’s overall compliance status that allows you to track risks, vendors, audits, and frameworks at a glance.
Key Metrics: Track the top priorities of your GRC program, with the ability to drill down into each metric for detailed insights.
Compliance Progress: Visualize overall compliance with a consolidated representation of the percentage of compliant controls.
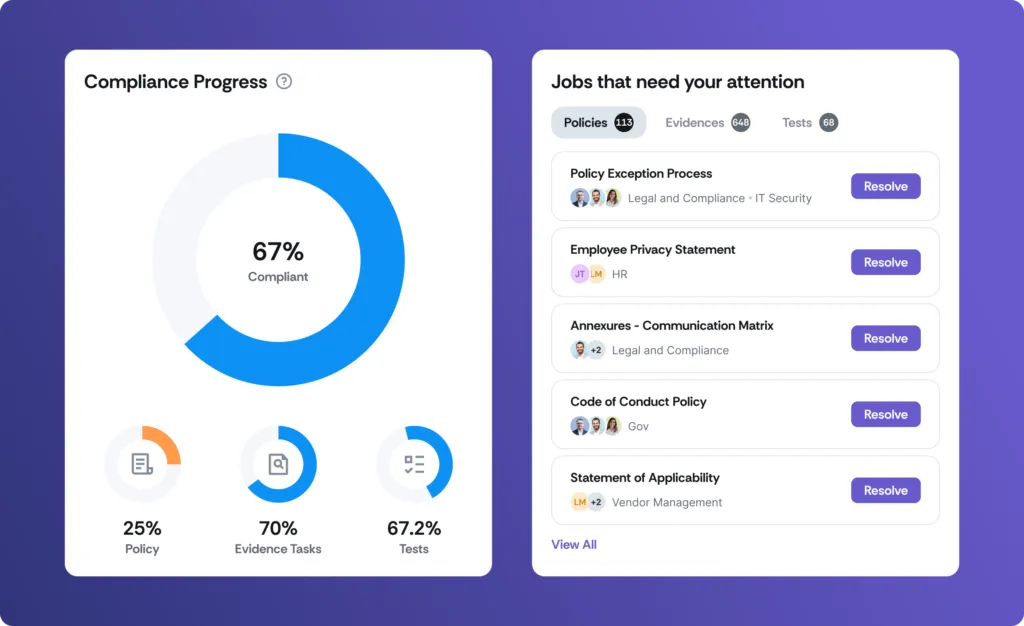
Tasks Overview: Monitor blockers in policies, evidence, and tests. Take the required action on each artifact instantly.
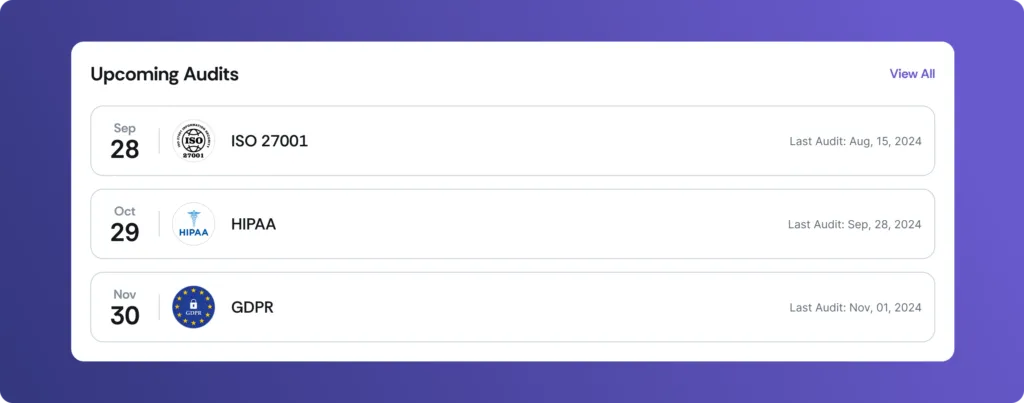
Audit Tracker: Keep track of the timelines of upcoming audits for corresponding frameworks, and add requirements with a click as needed.
b. Controls Dashboard
Monitor and manage controls across multiple frameworks in detail, with a clear view of controls under various entities and domains.
Compliance Overview: Monitor and drill down on the number of controls spread across different stages of readiness.
Function Planner: Visualize distribution across key functions to prioritize controls falling under specific function categories.
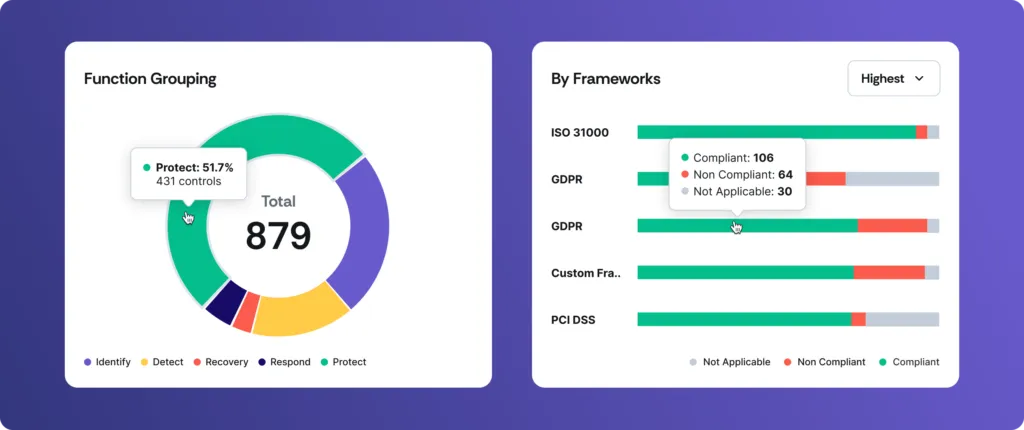
Framework Overview: Track control compliance status against multiple frameworks.

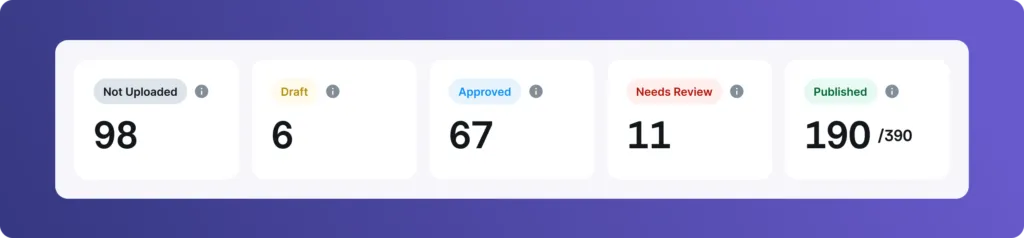
c. Policy Dashboard
Simplify policy management with a clear view of policy statuses, departmental prioritization, and upcoming reviews.
Key Overview: Visualize the total number of policies across each stage of the creation to publishing lifecycle.
Departmental focus: Compare stages of policy publishing through a department-wise and personnel-wise view.
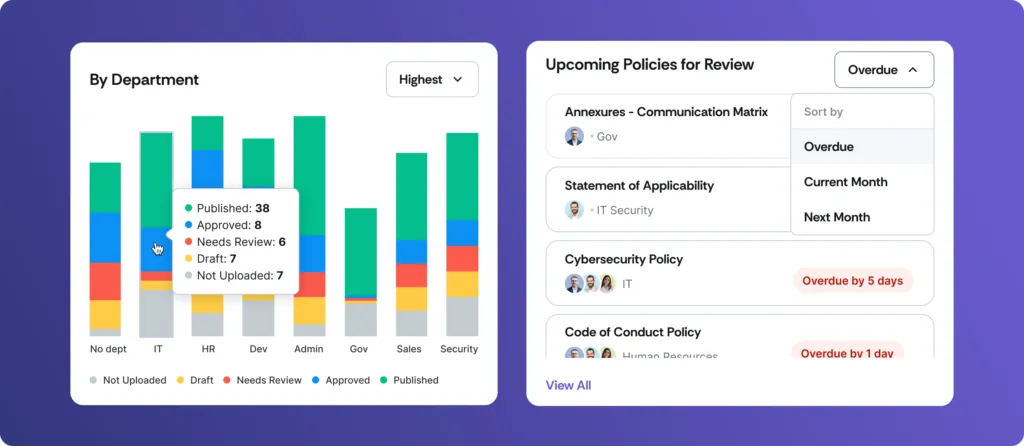
Policy Review Planner: Easily track upcoming or overdue policy reviews, complete with timestamps, so you can ensure nothing slips through the cracks.
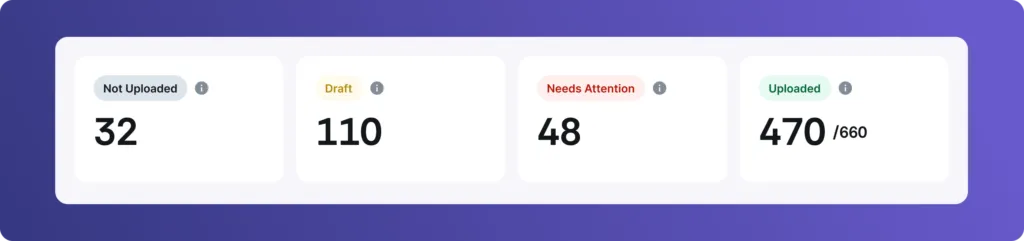
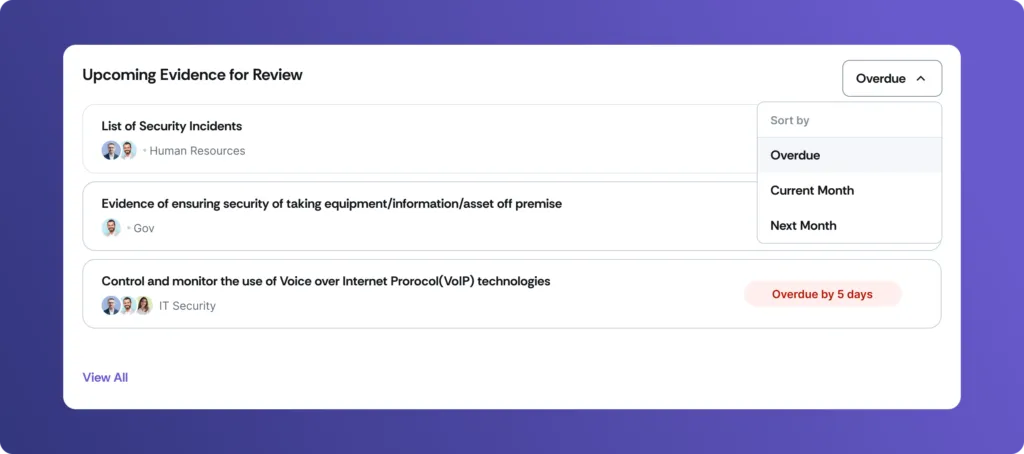
d. Evidence Dashboard
Simplify evidence tracking and get a clear overview of departmental and individual responsibilities, ensuring that all necessary evidence is gathered and kept current.
Key Metrics: Visualize the total number of evidence across each stage of the creation to uploading lifecycle.
Personnel Overview: Track the evidence assigned to each person, ensuring accountability and timely completion.

Framework Progress: Monitor the progress of evidence collection against each framework, providing a comprehensive view of compliance efforts.
Evidence Review Planner: Proactively prepare for upcoming evidence reviews with a view that lets you sort unreviewed evidence that is upcoming or overdue.

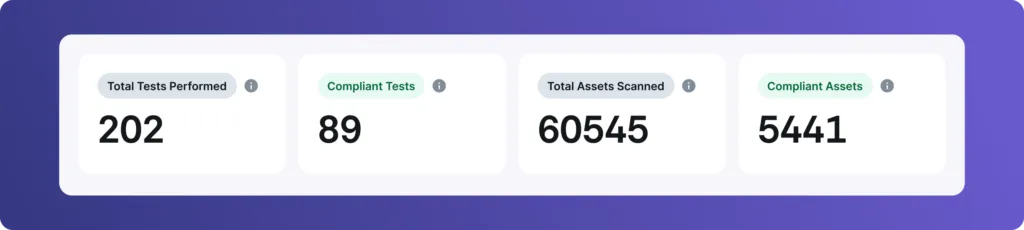
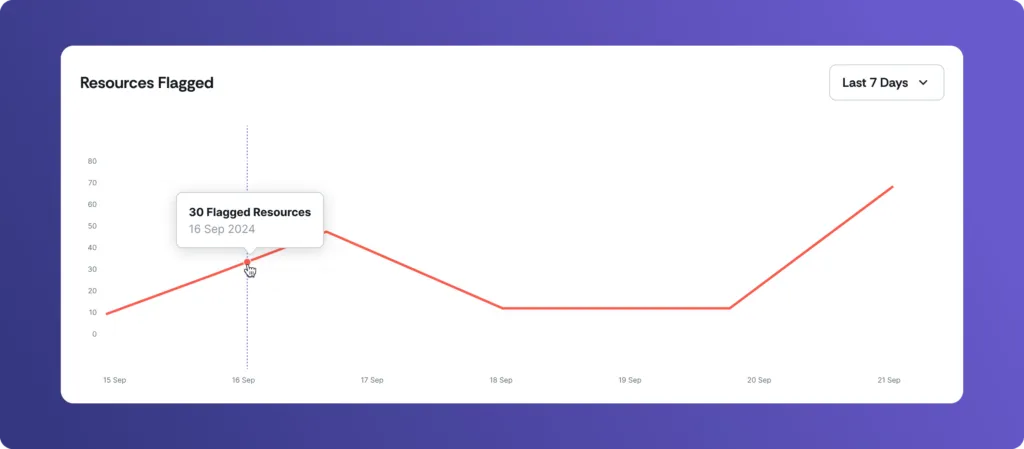
e. Cloud Dashboard
Proactively manage risks by tracking non-compliant assets and flagged resources across your cloud environments.
Key Metrics: Monitor stats of daily automated tests conducted, and further drill down for actionable visibility.
Resource Summary: Visualize and compare flagged resources for efficient resolution, across multiple services, entities, and assignees.

Flagged Resources: Monitor the number of resources flagged historically, to plan for effective remediation strategies.
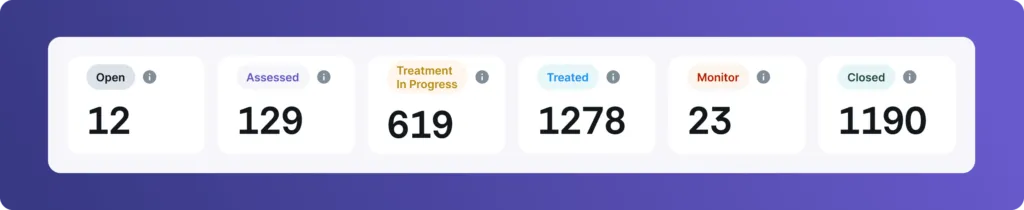
f. Risk Dashboard
Manage risks by visualizing critical risks, prioritizing them, and analyzing the efficiency of your mitigation strategies.
Key Metrics: Monitor risks present in each stage of the risk lifecycle, with drill-down capability into each stage.
Treatment Overview: Prioritize risks based on likelihood and impact, under multiple treatment strategies, and monitor the effectiveness of risk treatment.
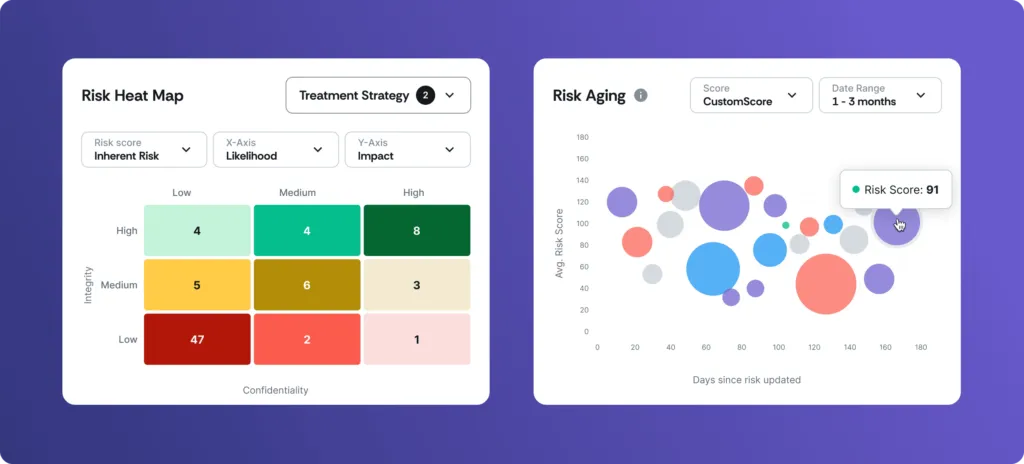
Unmanaged Risks: Monitor risks not updated for longer periods of time and formulate relevant actions for treatment.

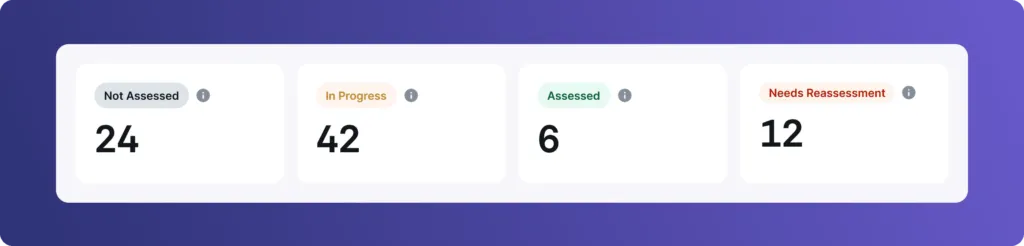
g. Vendor Dashboard
Monitor your vendor ecosystem’s security posture, assessment progress, and remediation efforts with drill-down capabilities for deeper insights.
Overall Progress: Monitor vendor assessments in different stages and track average response times.
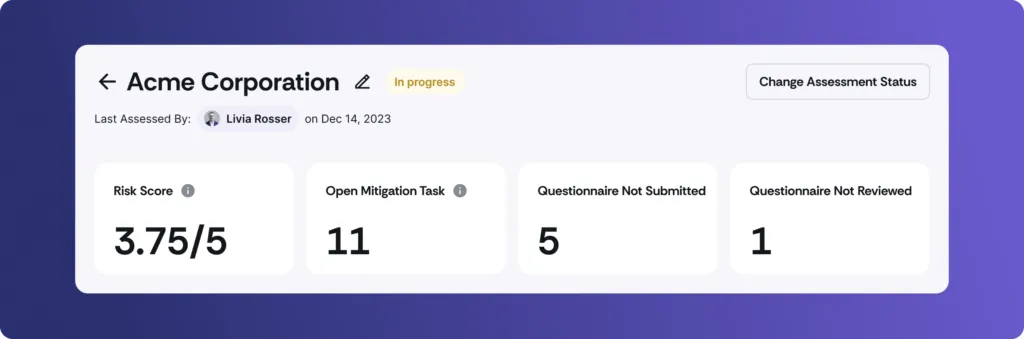
Key Metrics: Snapshot of the overall risk profile and current state of tasks logged for each vendor.
Mitigation Tracker: Identify and prioritize mitigation tasks spread across multiple stages.
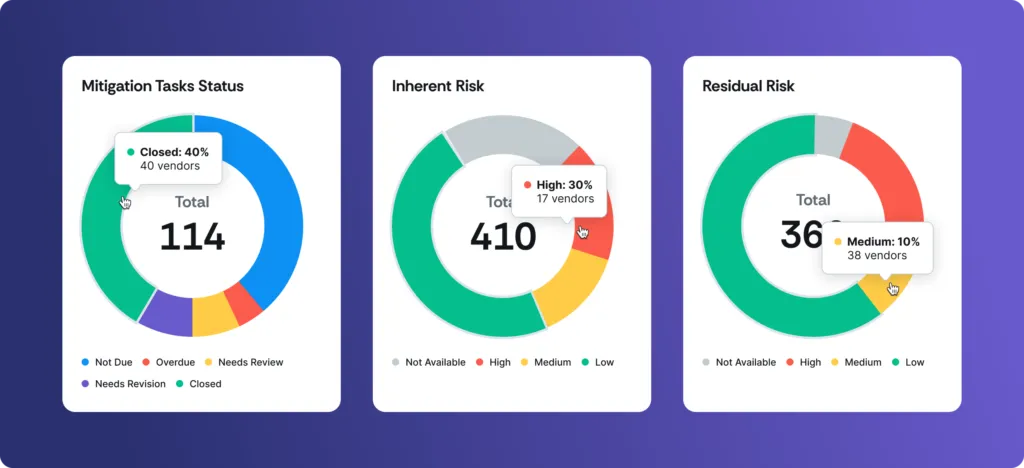
Remediation Analysis: Get a comparative view of risks across all levels, pre and post mitigation, to understand the effectiveness of remediations.

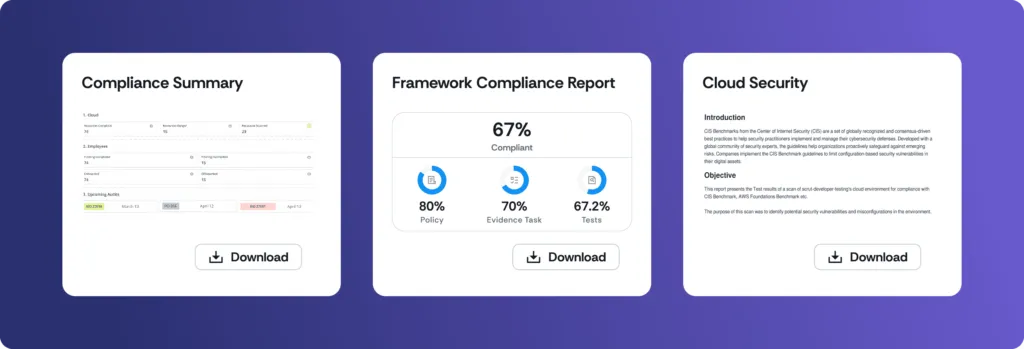
h. Cloud Security Report
Comprehensive, real-time overview of your cloud security posture, including assets scanned, flagged resources, and affected controls.
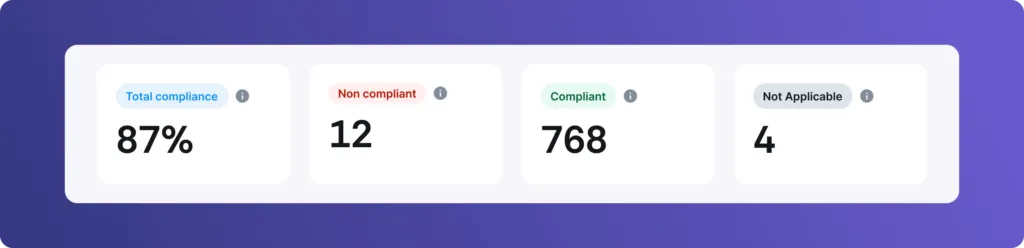
i. Framework Compliance Report
Identify and address non-compliant controls within specific frameworks to make it easier to prioritize and update leadership and auditors.
j. Compliance Summary Report
Complete summary of your compliance progress, including controls, vendor assessments, and employee security training.

Simplify your GRC journey with Scrut
Improper prioritization due to a lack of visibility can make GRC more complicated than it needs to be. Scrut’s dashboards and reports offer a smart and effective way to manage compliance, mitigate risks, and stay ahead of the curve. Whether you’re looking to optimize your risk remediation processes or maintain a strong compliance posture, Scrut has the tools you need to make your GRC operations effortless.
Ready to see Scrut in action? Schedule a demo with us today to learn more.
Dashboards and reports are powerful tools integrated into the Scrut platform that provide visual, real-time insights into various aspects of your organization’s governance, risk, and compliance (GRC) efforts. These dashboards help you monitor, manage, and communicate your compliance status and risk posture effectively.
Dashboards centralize and visualize data from different departments, making it easier to track progress, identify risks, and manage compliance across your organization. They reduce the need for manual data collection and provide actionable insights to help you stay ahead of compliance requirements.
Yes, Scrut allows you to customize your dashboards to fit your organization’s specific needs. You can tailor the view to highlight the metrics and information most relevant to your compliance and risk management goals.
Scrut streamlines the audit process by providing a comprehensive view of your compliance status, making it easy to prepare for and manage audits. The platform offers real-time tracking of audit progress, evidence collection, and control compliance, helping you stay organized and audit-ready.
Absolutely. Dashboards and reports are designed with ease of communication in mind. You can quickly generate and share detailed reports with senior management, board members, auditors, or other stakeholders, ensuring everyone stays informed and aligned.


.png)